WHAM Participant Demographics
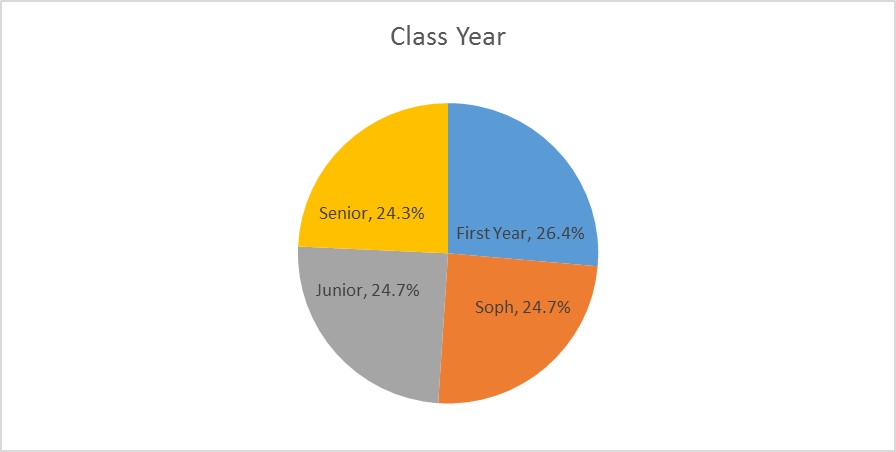
Class Year
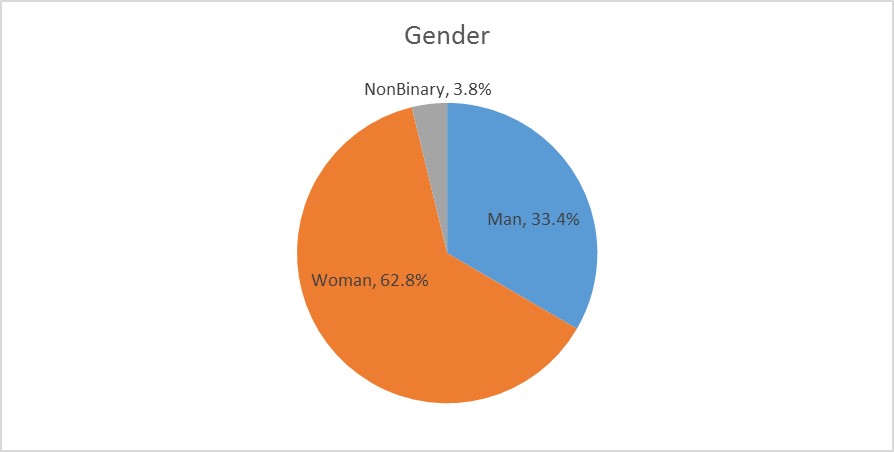
Gender
Race/Ethnicity
The question about race/ethnicity allowed respondents to select all the races/ethnicities that applied to them, which is more nuanced than the way many colleges and universities report race (visit Collecting Race and Ethnicity Data from Students and Staff Using the New Categories for federal reporting requirements). In this case, percentages will add to more than 100 percent. The majority of respondents (78 percent) selected one race, 18 percent selected two races/ethnicities and 4 percent selected three or more.
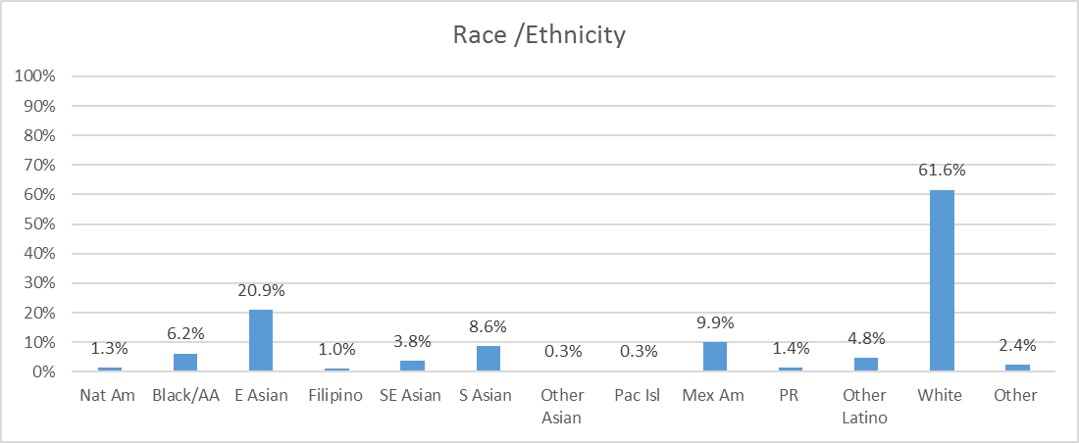
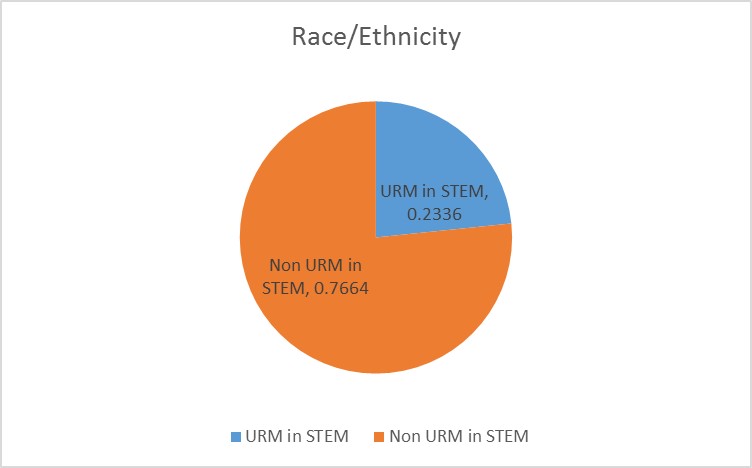
Given the small number of respondents in some categories, race/ethnicity was recoded to be able to examine the results more fully while still protecting respondent confidentiality. Respondents who indicated they were White, Asian or White + Asian were recoded into Non-underrepresented in STEM, while students who indicated they were Native American, Black or African American, Hispanic, or a combination of White/Asian and any of those races/ethnicities, were coded as Underrepresented in STEM.
International Students
6.9 percent of respondents indicated they were international students. Approximately 10 percent of HMC’s student body in 2017 were international students.
First-Generation Students
5.5 percent of respondents indicated they were the first in their family to attend college. Approximately 14 percent of the two previous incoming classes at HMC were first-generation students.
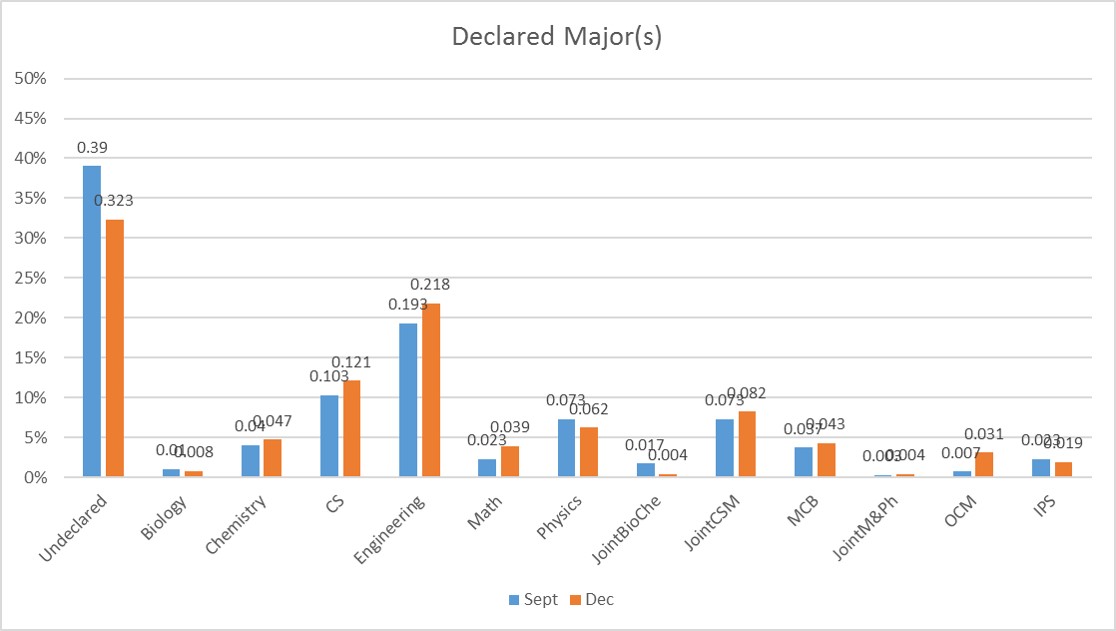
Major
We asked about students’ majors two times, once in September, then again in December. This was done to capture changes in major over the semester. The graph below includes all majors respondents selected.
