Financial Review (2021–2022)
As noted in the financial charts listed below, the College’s financial position remains strong despite the challenges caused by the COVID-19 pandemic. The College experienced a successful return to campus and was able to navigate the ever-changing COVID-19 environment. Additionally, the College ended the years with positive operating results. We believe that the College’s strong financial position will continue to support the College’s mission for years to come.
Endowment Market Value
(In thousands)
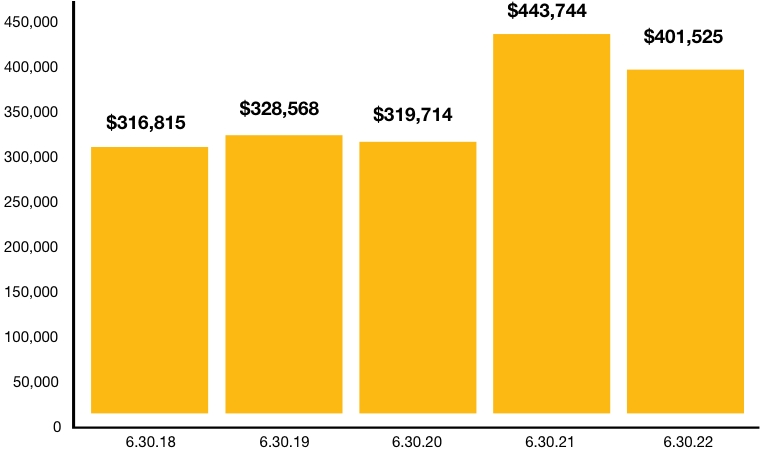
$402 Million
JUNE 30, 2022
Statement of Activities
Revenue
| Category | 2022 | 2021 |
|---|---|---|
| Net students revenues | $71,011 | $48,754 |
| Less financial aid | ($20,375) | ($14,784) |
| Net student revenues | $50,636 | $33,970 |
| Federal grants | $2,855 | $4,575 |
| Private gifts and grants | $14,762 | $10,387 |
| Private contracts | $2,096 | $1,580 |
| Endowment payouts | $15,958 | $15,659 |
| Other revenue | $530 | $383 |
| Total Revenue | $86,837 | $66,554 |
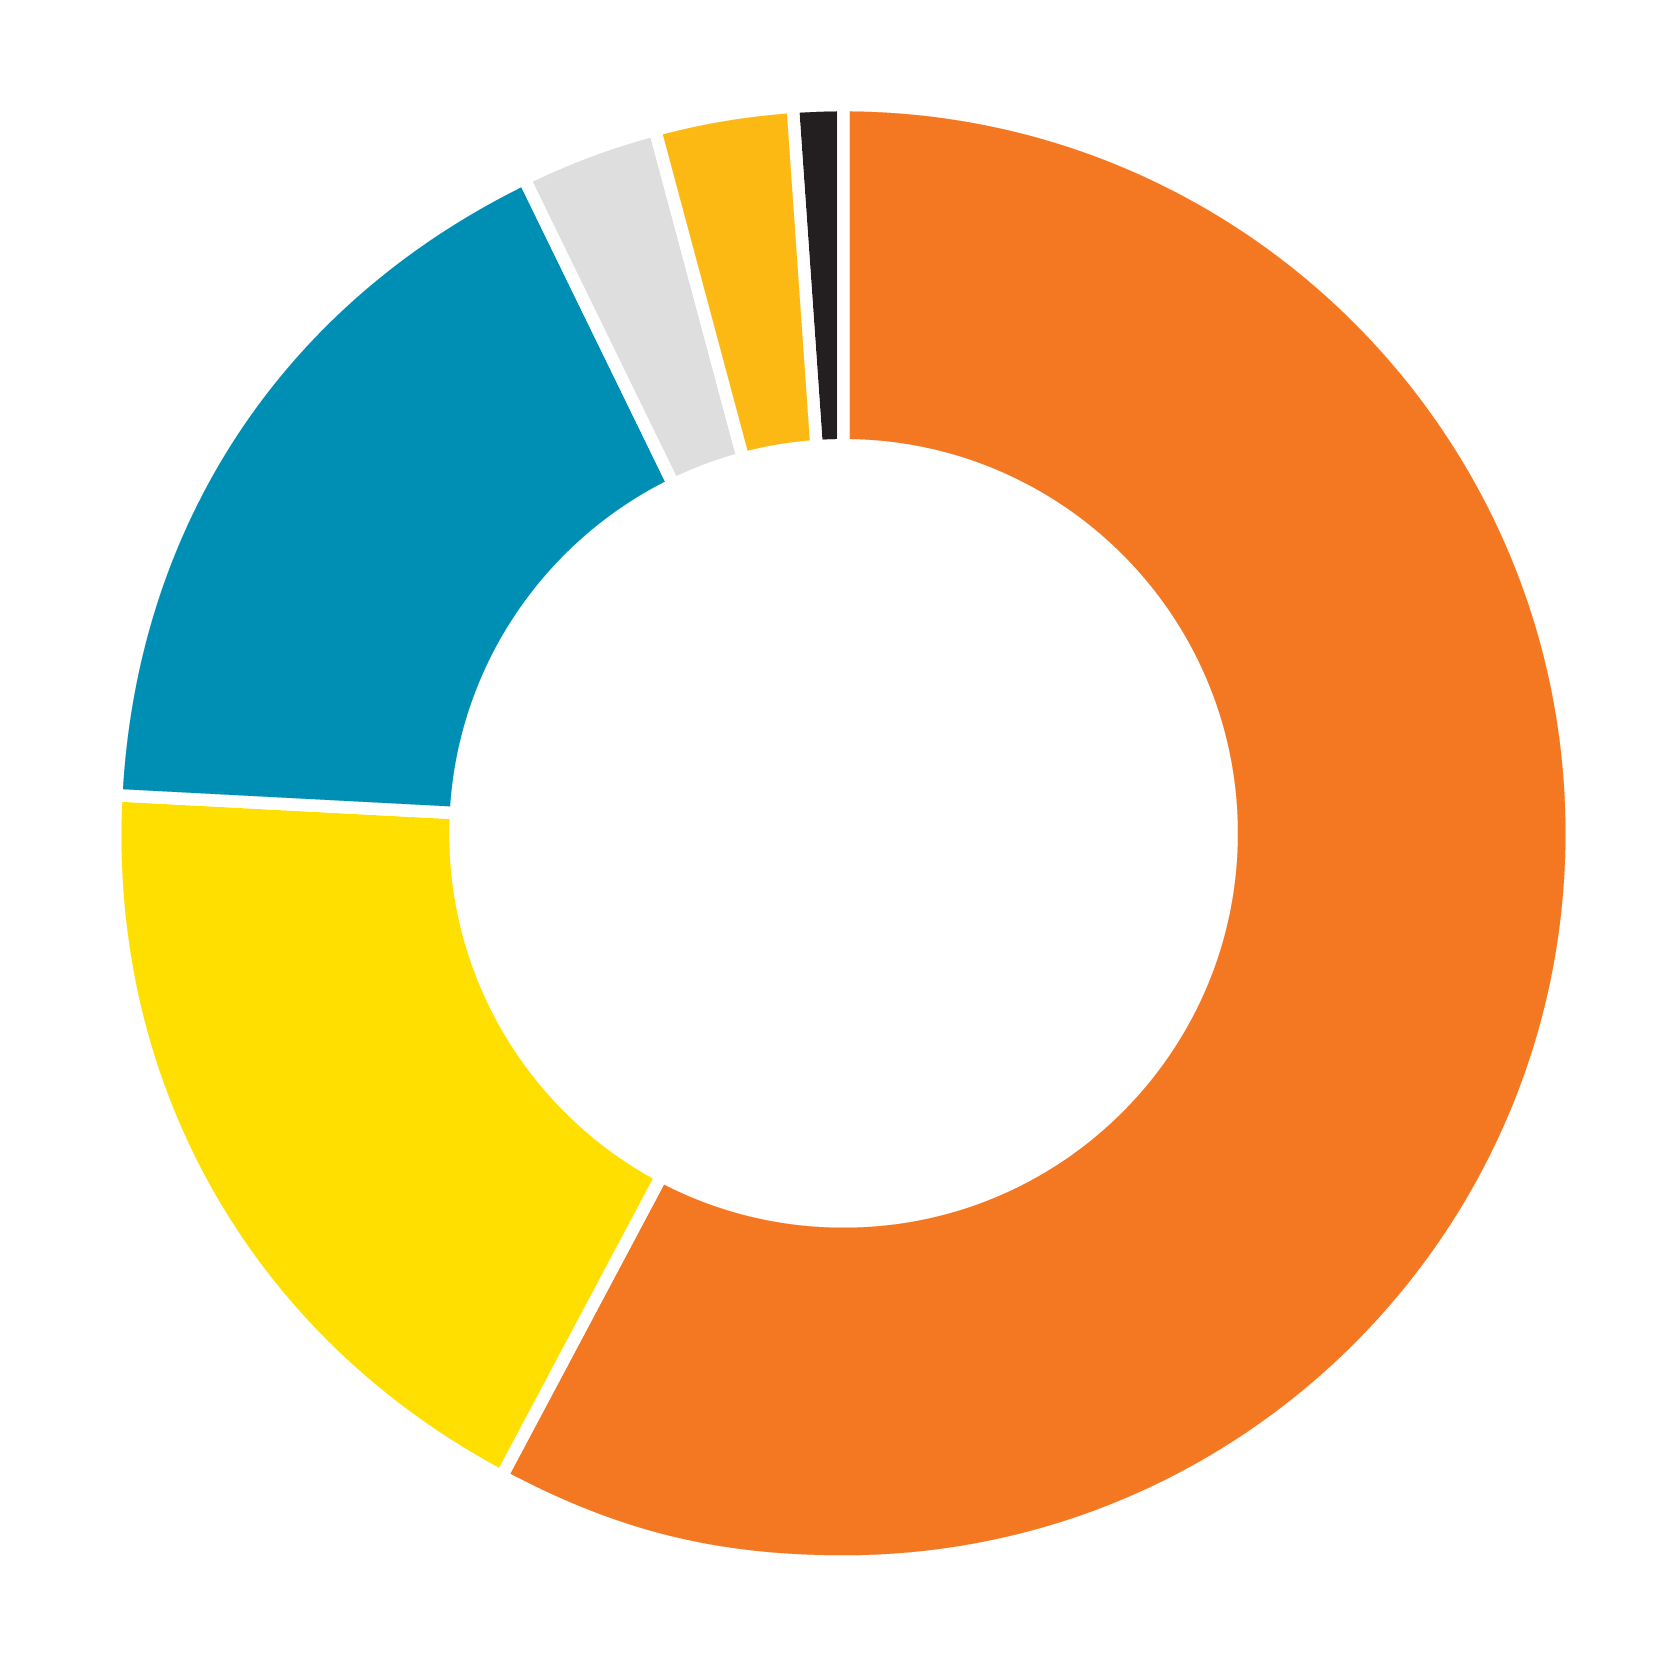
- Net student revenues, 58%
- Endowment payout, 18%
- Private gifts and grants, 17%
- Federal grants, 3%
- Private contracts, 3%
- Other revenue, 1%
Expenses
| Category | 2022 | 2021 |
|---|---|---|
| Instruction | $30,478 | $27,736 |
| Research | $4,156 | $3,035 |
| Public service | $756 | $687 |
| Academic support | $6,958 | $5,850 |
| Students services | $8,523 | $7,954 |
| Institutional support | $12,503 | $9,930 |
| Auxiliary enterprises | $12,428 | $6,748 |
| Total Expenses | 75,802 | $61,940 |
| Total Expenses | 75,802 | $61,940 |
|---|---|---|
| Excess revenue over expenses | $11,035 | $4,614 |
| Polled investment (losses), net of endowment payout | ($45,243) | $119,461 |
| Other changes in net assets | $9 | $1,407 |
| Change in net assets | ($34,199) | $125,482 |

- Instruction, 40%
- Institutional support, 17%
- Auxiliary enterprises, 16%
- Student services, 11%
- Research, 6%
- Academic support, 9%
- Public service, 1%