NMR at Harvey Mudd College
Nuclear magnetic resonance (NMR) spectroscopy is one of the most powerful spectroscopic tools available to chemists, providing a means to study molecular properties and structure.
NMR Resources Instrumentation
The Harvey Mudd College Department of Chemistry has a Bruker Avance NEO 400 – a state-of-the-art Fourier transform system with a 400MHz cryogenic magnet and gradient probe capable of high-resolution spectroscopy on a wide range of nuclei, ranging in resonant frequency from 109Ag to31P.
Data Analysis Software
TopSpin is the data acquisition and analysis package running on the Avance NEO 400. TopSpin also runs on the NMR workstation and can be downloaded on PCs and Macs for offline data analysis. TopSpin can analyze one-, two-, and three-dimensional data generated on the Avance NEO 400.
Information via NMR
There are three types of information available in NMR spectroscopy:
- Chemical shift, which provides information about the average effective magnetic field (due to nuclear shielding) present at various locations within a molecule.
- Spin-spin coupling (coupling constants and spin multiplicities), which derives from through-bond interactions between spin-active nuclei.
- Signal intensity, measured as the integral of the signal, which derives from the number of equivalent nuclei present in a given environment.
Of course, it is possible to garner additional information via other processes, such as the nuclear Overhauser effect (NOE).
IconNMR
IconNMR is the data acquisition software available for walk-on users of the Avance NEO 400. IconNMR provides an easy-to-use interface for common 1H and13C experiments in a range of common NMR solvents. IconNMR also provides access to experiments on other nuclei (such as 15N,19F, and 31P).
IconNMR handles the following tasks in setting up, running, and processing an NMR experiment:
- Sample loading;
- Lock on the solvent;
- Tune and match the probe;
- Shim the magnet;
- Acquire the FID;
- Process the FID by Fourier transformation and phasing the resulting spectrum;
- Integrate peak;
- Label peaks; and
- Plot the spectrum.
Of course, your data are available for offline processing with TopSpin at any time. This may be useful if you do not like the phasing and/or integration done by IconNMR. You may also wish to expand or replot a section of your spectrum.
1H
Experiment Name – PROTON
Discussion
This is the simplest, most straightforward NMR experiment, taken right out of your organic chemistry textbook.
In this experiment, a short radio-frequency pulse centered on the Larmor precession frequency of protons in the static magnetic field created by the cryomagnet causes a net transverse magnetization of the protons. This transverse magnetization is monitored as the sample decays exponentially toward its equilibrium state, providing a Free Induction Decay, or FID. The FID contains all of the spectral information in the time domain. Subjecting the FID to a fast Fourier transform produces the spectrum in the frequency domain. Before it can be read, the spectrum must be phased. Subsequent processing allows for integration and peak picking.
Note that you can select PROTON (16 scans). More scans buy you better signal-to-noise (S/N), but take longer to execute. Since it takes roughly 5 min for the spectrometer to lock and achieve a good shim, the extra 5 min required to move from 8 scans to 128 scans isn’t really that excessive…
Recall that S/N ratio is proportional to the square root of the number of scans you take; doubling the number of scans increases your S/N by a factor of 21/2. More advanced users may wish to set the NS (number of scans) parameter manually.
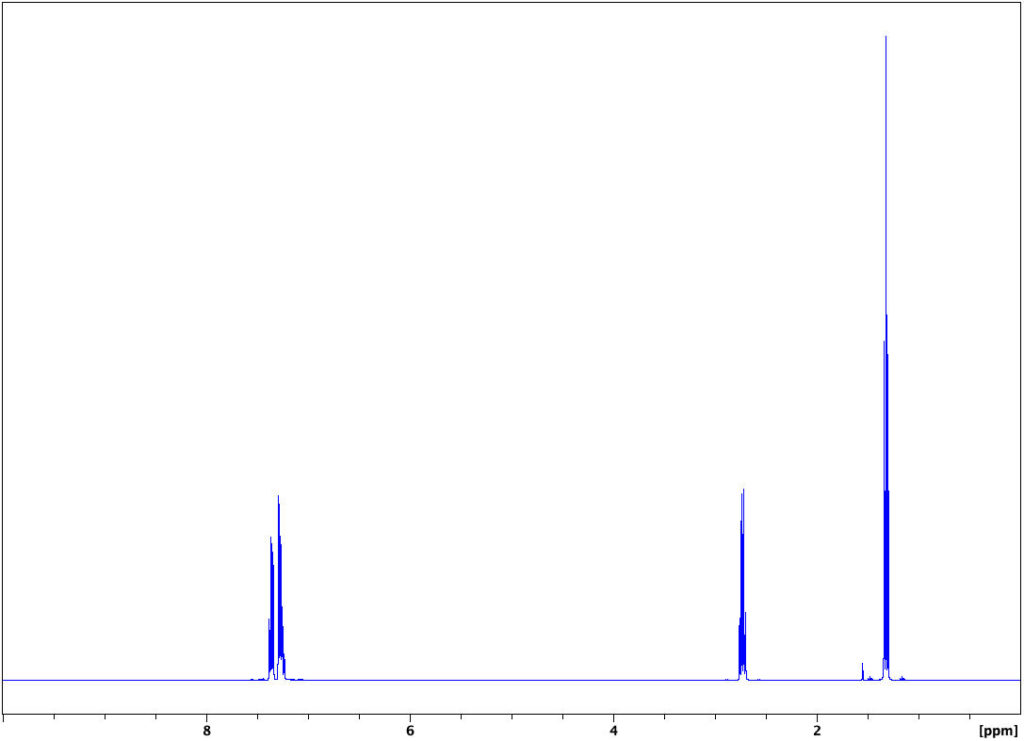
In this page and the following pages, a series of spectra are presented for ethylbenzene:
The triplet at 1.25 ppm with integral of 3 corresponds to the protons Ha in the methyl group, whereas the quadruplet at 2.65 ppm with integral of 2 corresponds to the methylene protons, Hb. The multiplets at 7.25 ppm with integral of 5 correspond to the aromatic protons Hc. The singlet at 0 ppm is due to the internal standard, tetramethylsilane (TMS).
Note that the chemical shifts, when expressed in ppm of applied magnetic field, do not change with field strength. The spin-spin coupling (J-constants) is not field-dependent, either.
Spectrum of Ethylbenzene
13C Without Decoupling
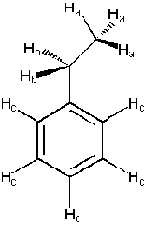
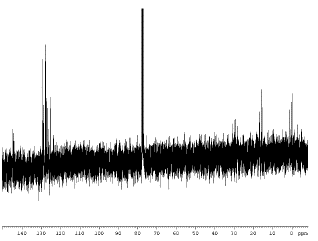
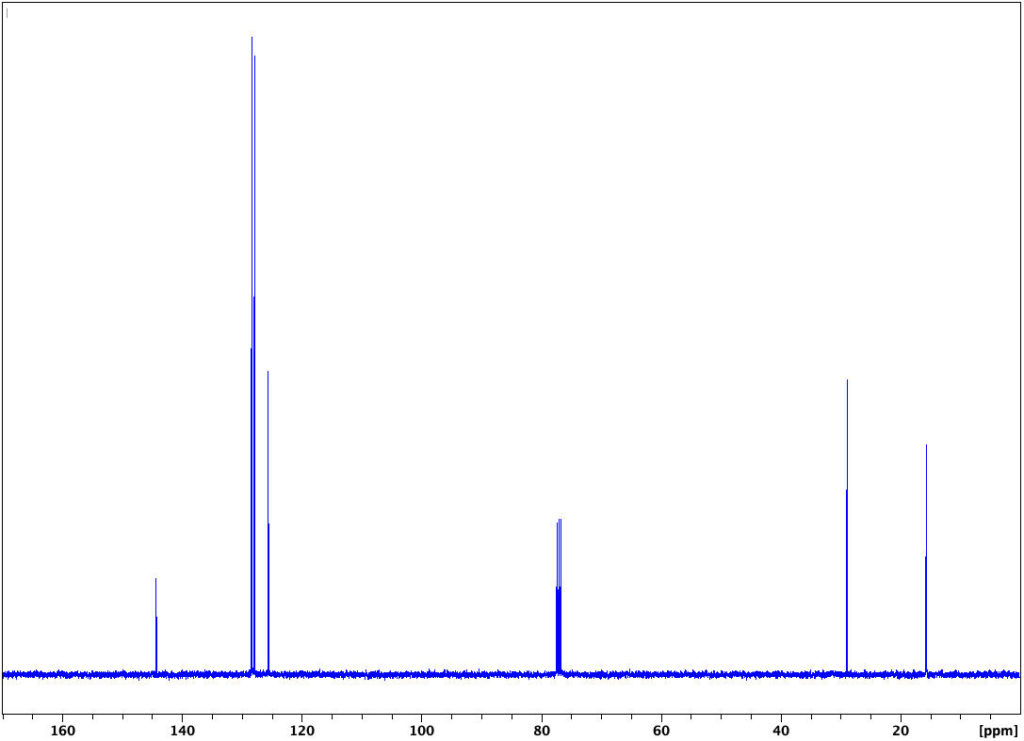
The 13C experiment without decoupling of attached protons is quite similar to the standard 1H experiment. A short radio-frequency pulse centered on the Larmor precession frequency of 13C nuclei in the static magnetic field created by the cryomagnet causes a net transverse magnetization of the carbon nuclei. This transverse magnetization is monitored as the sample decays exponentially toward its equilibrium state, providing a Free Induction Decay, or FID. The FID contains all of the spectral information in the time domain. Subjecting the FID to a fast Fourier transform produces the spectrum in the frequency domain. Before it can be read, the spectrum must be phased. Subsequent processing allows for integration and peak picking. Note that both 13C and 1H are spin1/2nuclei. We expect to see a signal for each magnetically-unique carbon, split into n+1 peaks, where n is the number of protons attached to the carbon. Of course, the signal from 13C is much weaker than that of a proton because only 1.1% of all carbons present in a molecule are 13C–the balance is 12C, which does not give an NMR signal. This also explains why we don’t see spin-spin coupling from adjacent carbons – the chance of two adjacent carbons both being 13C is 0.012% (pretty small!). Also, the magnetogyric ratio for 13C is only 23% that of the proton. All things considered, this is a difficult and time-consuming experiment to attempt, which explains why we don’t do it very often. Note the triplet at 77ppm due to CDCl3(solvent) in the spectrum below. This signal is very strong because the sample is mostly CDCl3. The carbon in CDCl3 is split into a triplet because the D attached to it is a spin +1 nucleus: the D can be in any one of three spin states (-1, 0 or +1). Thus, any given carbon in the solvent “sees” one of three distinct environments, depending upon the spin state of its attached D.
Spectrum of Ethylbenzene
13C CPD
Experiment – 13C CPD
Discussion
Whereas 13C spectroscopy without decoupling is time-consuming and sometimes difficult to interpret, decoupling the protons from the carbon nuclei while obtaining the carbon spectrum yields stunning results. We obtain a singlet for each magnetically-unique carbon.13C spectroscopy garners information about the backbone of an organic molecule. The wonders of Fourier transform instruments allow us to surmount S/N problems associated with the low isotopic abundance of 13C and its rather poor magnetogyric ratio.
In the CPD (Composite Programmed Decoupling) technique, we decouple the protons from the carbon by means of an intricate radio-frequency pulse sequence directed at the protons. This means that the protons are continually changing spin state during the time the carbon spectrum is acquired. As a result, the carbon “sees” only one net proton environment, yielding only one peak for each magnetically-unique carbon.
The area under the peaks is generally not proportional to the number of carbons present in these experiments, due to relaxation effects. In order to achieve good results in integration, you must wait 10-20s between pulses. Typically, we are too impatient to do so.
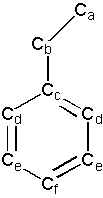
This is the fastest 13C experiment to carry out. As a result, it is the “standard” 13C experiment on newer spectrometers. In the spectrum below, the peak at 15 ppm is the methyl carbon Ca and the peak at 28 ppm is the methylene carbon Cb. The quarternary carbon in the benzene ring Cc(the one without an attached proton) is at 144 ppm. The remaining three peaks at 125, 127, and 128 ppm are the remaining aromatic carbons. Note that even though there are five additional carbons in the ring, there are only three magnetically unique signals. Also, note the triplet due to CDCl3(solvent) at 77 ppm in the spectrum below.
Spectrum of Ethylbenzene
13C DEPT
Experiment – 13C DEPT45
Discussion
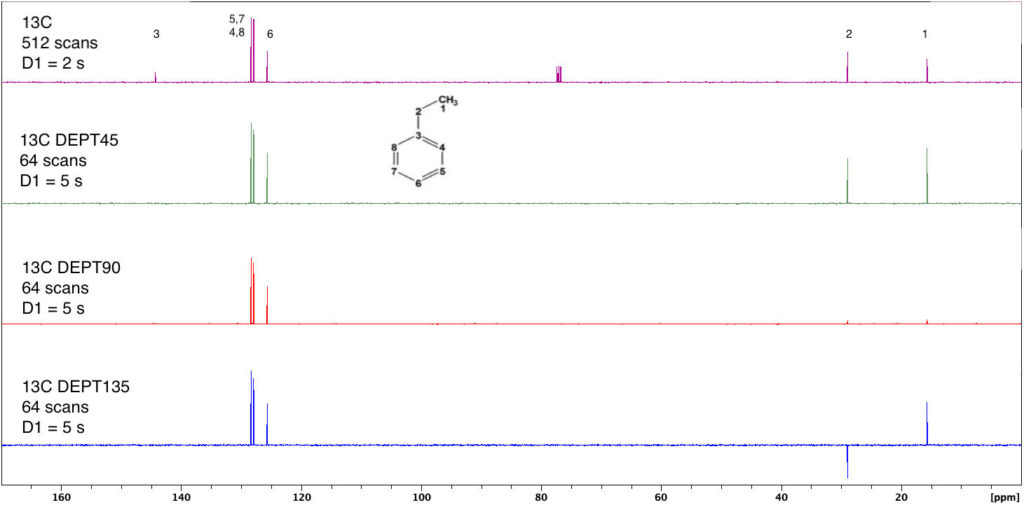
The DEPT experiment (Distortionless Enhancement by Polarization Transfer) is an example of a carbon-editing pulse sequence. Systematic changes in the internal delays in the complex pulse program make different carbons respond in different fashions, depending upon the number of protons attached.
The DEPT 45 experiment yields a positive peak for every carbon with attached protons: C1at 16 ppm, C2at 29 ppm, and C4, C5, and C6at 128.5, 128.9, and 129 ppm, respectively. Note in the spectrum below that carbon in the CDCl3solvent does not give a signal since it has no attached protons.
Experiment – 13C DEPT90
Discussion
In this variant of the DEPT experiment, only CH yields peaks; CH0, CH2, and CH3 are invisible. In our example, we see only three lines due to C4, C5, and C6in the aromatic range from 126 to 129 ppm.
Experiment – 13C DEPT135
Discussion
In this variant of the DEPT experiment, CH1, CH3 yield positive peaks, whereas and CH2 are negative. In our example, we see only three positive lines due to C4, C5, and C6in the aromatic range from 126 to 129 ppm, while the CH2 at 29 ppm is negative.
2D NMR: HSQC
Experiment – HSQCGP
Discussion
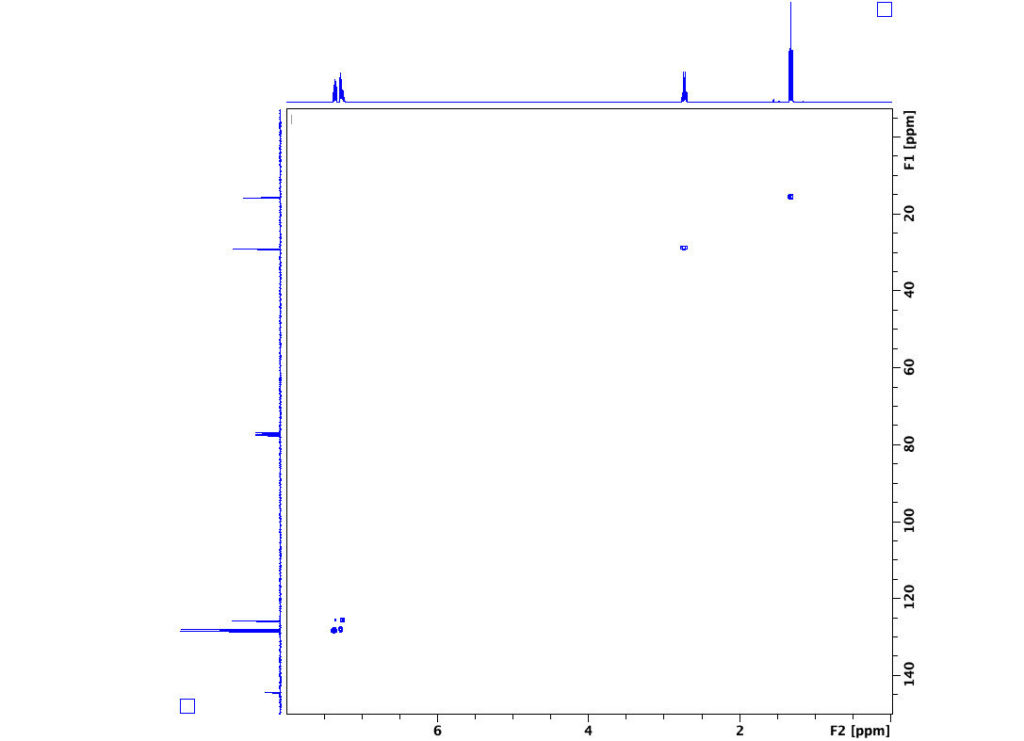
Two-dimensional HSQC (Heteronuclear Single Quantum Coherence) experiments allow you to determine the connectivity of a molecule by determining which protons are correlated with which carbons. In these examples, “correlated” means directly bonded.
HSQCGP is an inverse-detection experiment observing protons while utilizing magnetic gradients along the bore of the sample. There are many advantages to this approach; this experiment will yield superior signal-to-noise ratios in shorter times than traditional experiments.
In the spectrum below, the proton spectrum appears across the top, while the “imputed” carbon spectrum appears along the left-hand side. Peaks within the grid arise from correlations between a given proton and carbon signal. For example, the methyl protons seen at 1.3 ppm on the proton axis are coupled to the methyl carbon at 16 ppm on the carbon axis.
Spectrum of Ethylbenzene
2D NMR: COSY
Experiment -COSYGP
Discussion
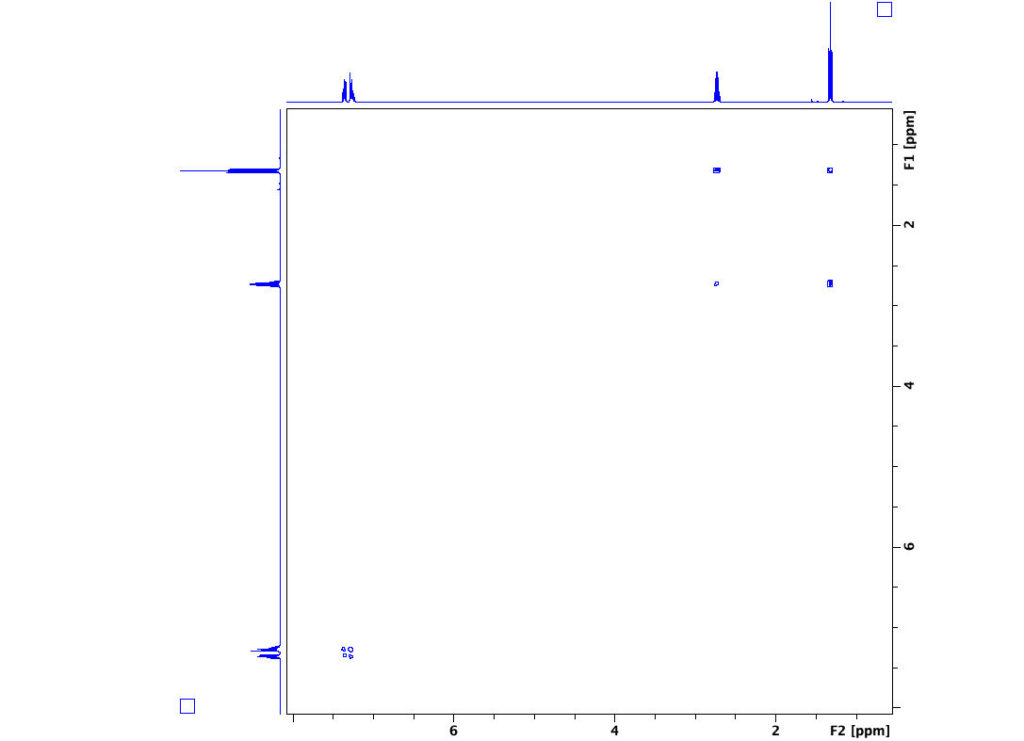
Two-dimensional COSY (COrrelation SpectroscopY) experiments allow you to determine the connectivity of a molecule by determining which protons are spin-spin coupled. Of course, one could accomplish the same task by a detailed analysis of spin-spin splittings, given high enough resolution. Nonetheless, COSY spectroscopy, when practiced with the aid of magnetic field gradients, is a quick method of establishing connectivity.
In the example shown below the proton spectrum for ethylbenzene is plotted on each of the two axes. Note that the diagonal within the box is also the spectrum for ethylbenzene as seen from “above.” Off-diagonal peaks denote splitting between protons on adjacent carbons. Note the coupling of the methyl protons at 1.3 ppm to the methylene protons at 2.7 ppm. The aromatic multiplet at 7.3 ppm is coupled with itself. Also, note that neither the methyl nor methylene protons are coupled to the aromatic protons at 7.3 ppm.
This COSY experiment gives information regarding three-bond couplings (from a proton to its carbon, to the adjacent carbon, then to that carbon’s proton). More extensive COSY spectra may be generated by advanced techniques, allowing one to view four-, five-, and occasionally six-bond couplings.
Finally, another class of experiments, known collectively as nuclear Overhauser effect (NOE) experiments, provide information on through-space rather than through-bond couplings. Such experiments are very important in the use of NMR to establish tertiary and structure.
Spectrum of Ethylbenzene
Specifications Chart
IconNMR Experiments
Currently defined IconNMR experiments of interest to the novice user are shown below.
More advanced users may select from a greater range of experiments. In addition, experimental parameters, such as D1, NS, and TE may be changed with IconNMR’s EDIT PARAMETERS menu.
| Experiment Name | Description | Sampling Time |
|---|---|---|
| PROTON | 1H spectrum with integration & peak picking. | 8 scans 1.5 min |
| 13C CPD | 13C spectrum with gated decoupling and peak picking | 1024 scans 58 min |
| 13C DEPT45 | 13C 45° DEPT (Distortionless Enhancement by Polarization Transfer), shows only CHx(all positive) | 32 scans 13 min |
| 13C DEPT90 | 13C 90° DEPT, shows only CH (all positive) | 32 scans 2 min |
| 13C DEPT135 | 13C 135° DEPT, shows CH, CH3positive, CH2negative | 32 scans 2 min |
| COSYGS | 2-dimensional COSY (proton-proton COrrelation SpectroscopY) with gradients | 5 min |
| HSQCGP | 2-dimensional inverse-detection HSBC (Heteronuclear Single Quantum Coherence) Carbon-Hydrogen correlation with gradients | 14 min |
References
Bibliography
- Friebolin, Horst. (1998). Basic One- and Two-Dimensional NMR Spectroscopy. Weinheim: Wiley-VCH.
- Braun, S.; Kalinowski, H.-O.; Berger, S. (1998).150 and More Basic NMR Experiments. Weinheim: Wiley-VCH.
Acknowledgments
Acquisition of the Harvey Mudd College Bruker Avance DPX-400 spectrometer was made possible via the generous support of the following:
The National Science Foundation Major Research Instrumentation Program CHE-9724364.
The Camille and Henry Dreyfus Foundation’s Special Grant Program in the Chemical Sciences.
The Dow Chemical Foundation.
The Kenneth Norris Foundation.